Here is what we’ve learned from it, and a link for you to study the data yourself.
The Department of Homeland Security (DHS) is notoriously obscure about the systems it uses to detain immigrants in the United States. Without a court order, it is rare that DHS’s Immigration and Customs Enforcement (ICE) divulges any details about where its jails and prisons are located, who or how many people are held there, or any details about how they are managed — including how much taxpayers spend to keep them open, and who gets that money.
NIJC’s Transparency Project has detailed this lack of accountability in numerous reports, most recently in ICE Lies, where we teamed up with the Detention Watch Network to show how DHS's patterns of irresponsible governance— including fiscal mismanagement and secrecy in its detention operations — contribute to a failure of accountability for ongoing human rights violations. Last month, the DHS Office of Inspector General released a report finding that ICE violated federal procurement laws in 2014 when it signed, and in 2016 extended, a contract for more than $1 billion with private prison company Core Civic (formerly Corrections Corporation of America, or CCA) to build and operate the South Texas Family Residential Detention Center via a pass-through Inter-Governmental Service Agreement with the City of Eloy, Arizona.
This lack of transparency has become an issue in Congress’s federal budget negotiations, with advocates and a growing number of senators and representatives calling for appropriators to cut ICE’s funding.
In the past several months, ICE has released some facility information in response to Freedom of Information Act requests. Most recently, the Immigrant Legal Resource Center obtained an extensive and detailed list of DHS facilities in response to a FOIA request it filed as part of its research on sanctuary cities. This list contains a relative trove of information about how immigration detention is currently operating in the United States.
About the data: The set of 10 lists includes data on types of contracts, demographics, medical care providers, and inspections history for more than 1,000 federal facilities that detain immigrants, including county jails, Bureau of Prisons facilities, Office of Refugee Resettlement centers, hospitals, and hotels (more on those down below). Customs and Border Patrol facilities are not included in the data. DHS compiled the data between November 4 and 6, 2017 — about one month into fiscal year (FY) 2018.
Here are 7 highlights of what NIJC found in our review of this new data:
1. The number of people locked up by ICE reached a record high (again)
In November 2017, ICE reported that its total average daily population for FY 2018 was 39,322 people. This marks the second year in a row the U.S. government hit an unprecedented high in how many immigrants it incarcerates.
2. ICE is detaining kids, sometimes for months
ICE currently has nine facilities available to detain juveniles, with approximately six of those limited to under 72 hours. These are neither family detention centers nor Office of Refugee Resettlement children’s shelters; instead, ICE contracts with juvenile jails to hold children under 18 separate from adults, including their family members. The facilities used to jail children for longer than 72 hours are the Northern Oregon Juvenile Detention facility in The Dalles, Oregon; the Abraxas Academy Detention Center in Morgantown, Pennsylvania; and the Cowlitz County Juvenile facility in Longview, Washington. While the average detention population for these facilities is only one to three children, the average length of stay for a juvenile detained in one of the three facilities ranges from 100 to 240 days. This means that in recent years ICE has detained dozens of children in juvenile jails for many months on end, in remote locations far from family and any accessible legal representation.
3. ICE categorizes the vast majority of people locked up as posing no danger to the community
ICE reports that an average of 71 percent of people detained on a given day were subject to “mandatory detention” in the first month of FY 2018 (the only period for which this data was provided). An average of 51 percent of the daily population that month were marked as “non-criminal,” and 51 percent also were classified as posing “no threat.” Twenty-three percent were classified as the lowest “Level 1” threat, which typically includes people with low-level and nonviolent criminal convictions. Only 15 percent were classified at the highest threat level.
4. Private prison companies dominate the detention system
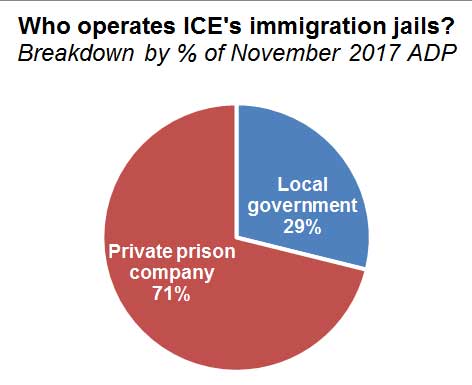
On an average day in November 2017, most people in ICE custody were in prisons operated by private companies.
About 71 percent of the average daily population that month were held in privately operated jails. An average of more than 15,000 people daily were held in 33 jails where local governments signed contracts with the federal government (known as Inter-Governmental Service Agreements or U.S. Marshal Service Intergovernmental Agreements) and then subcontracted facility operations to private, for-profit companies.
5. ICE contracts with hotels, and has detained thousands of people at one in San Diego
The facility lists include 12 hotels, some listed as active since 2009. Most of the hotels have never had an average daily population of more than three people — except the Quality Suites San Diego Otay Mesa. ICE has booked thousands of people into this hotel since fiscal year 2016, including children. Most of them were individuals transferred from another facility, but some were being booked into ICE custody for the first time. The maximum population listed for the first month of fiscal year 2018 was 120 people, and the average daily population at the hotel in fiscal year 2017 was 22 people. All of these individuals were listed as “non-criminal” with “no ICE threat level.”
6. Figuring out which detention standards govern a jail is still a murky business
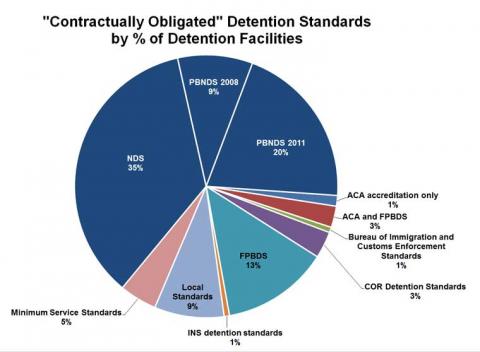
Only 65 percent of ICE's adult detention centers are contractually bound by one of the agency’s three sets of detention standards - known as the 2000 National Detention Standards (NDS), 2008 Performance-Based National Detention Standards (PBNDS), and 2011 PBNDS. About 14 percent of detained immigrants — an average of 5,000 people a day — are held in facilities contracted under other standards including American Correctional Association accreditation guidelines, the Department of Justice’s 2000 Federal Performance-Based Detention Standards (FPBDS) for federal prisons, and standards created by Immigration and Naturalization Service (INS), the agency that predated ICE. Some contracts only bind jail operators to the vaguely worded “minimum service standards,” “local standards,” or to “COR Detention Standards” which refer to the Contracting Officer Representative and pertain to enforcement of the technical aspects of a facility’s contract rather than conditions inside the jail.
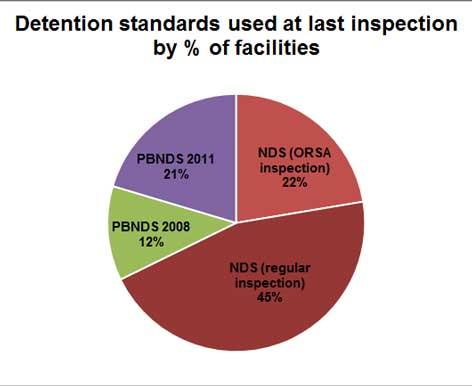
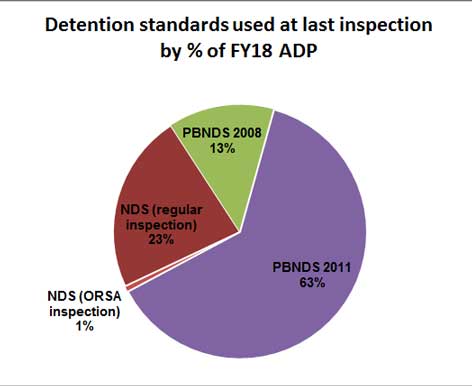
According to ICE, however, regardless of the standards listed in the contract, all of its facilities are inspected under one of the three sets of ICE standards. In 2014, the Government Accountability Office reported that, to avoid opening full detention contracts to negotiation, ICE sometimes obtains a facility’s agreement to be inspected according to a newer set of standards without explicitly incorporating the new standards into the contract. This practice has created a web of varying guidelines, making it difficult to untangle what standards actually govern a facility’s performance. According to the new data, which lists both the contracted standards and the standards applied at the last inspection, only 63 percent of immigrants are held in detention centers that were last inspected under the PBNDS 2011, the most robust set of guidelines. Twenty-four percent of immigrants are in jails inspected under the least stringent 2000 NDS, and 13 percent are in jails inspected under the PBNDS 2008. Twenty-two percent of immigration jails are smaller detention centers which were permitted to conduct their own inspections, known as Organizational Review Self-Assessments (ORSAs).*
7. No matter what happens to immigrants in their care, jails keep passing inspections
Every “authorized” ICE facility has passed every inspection since 2012, even those where multiple people have died, some later reported to be as a result of medical neglect. This pattern continues one which NIJC found in our 2015 analysis of ICE inspections reports, which revealed that only one out of 100 facilities was given a deficient rating on an annual inspection after 2009, when Congress passed an appropriations law stating the federal government must discontinue contracts with immigration detention facilities that fail two consecutive inspections. As in 2015, the new data suggests that facilities have an opportunity to have their final rating adjusted after an inspector finds it deficient. The ICE inspections involve two rounds of review before a final rating is assigned: the inspector makes a “recommended” rating, which then is reviewed by ICE and assigned a final rating. In the November 2017 list, four facilities are reported to have had a recommended rating in their last inspection of “deficient,” “at-risk,” or “does not meet standards.” As of November, the final rating for all of these jails had been pending for more than 100 days — by far the longest-pending inspections of more than 200 detention centers listed. The new list also reveals that in November 2017, ICE detained an average of 98 people per day at nine jails listed as “not inspected.”
The new data set also includes a list of 13 facilities classified as “use prohibited,” most of which are noted as having failed two consecutive inspections in 2008 and 2009, just before the appropriations law took effect. According to ICE’s list, some of these facilities still occasionally hold a small number of individuals.
View and download the Excel data file via Scribd
If you have questions, or spot an error in our analysis, contact NIJC via the press room.
Tara Tidwell Cullen is NIJC's director of communications.
*Correction: An earlier version of this post stated that 22 percent of immigrants were held in jails permitted to conduct their own unregulated “self-assessment” for their last inspections. It has been updated to reflect that 22 percent of immigration jails were permitted to conduct these types of inspections.


